One-sentence thesis
A settlement ratio compares two stages of the market process; it is not the percentage of trades that failed.
Key takeaways
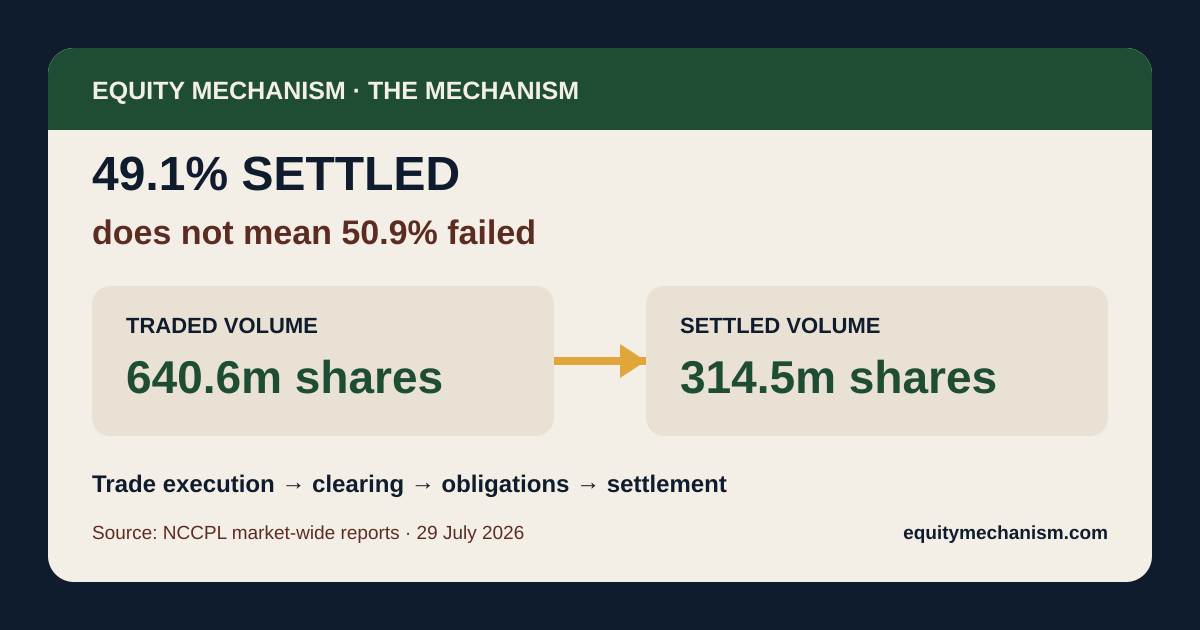
- NCCPL reported 640.6 million shares traded and 314.5 million shares settled on 29 July 2026.
- Settled volume was 49.10% of traded volume.
- That does not establish that the remaining 50.90% defaulted or failed delivery.
- The value-based settlement ratio was 56.26%, showing that share counts and rupee values can produce different ratios.
Trade execution → clearing → obligations calculated and offset where applicable → settlement
What happened
NCCPL's market-wide trade-versus-settlement reports showed 640,570,709 shares traded and 314,498,463 shares settled on 29 July 2026.
Calculated from those official figures, settled volume equalled 49.10% of traded volume.
The value report showed PKR 33.22 billion traded and PKR 18.69 billion settled. The corresponding value ratio was 56.26%.
These are two valid comparisons, but they answer different questions.
The mechanism
A trade begins when a buyer and seller execute a transaction in the market. Settlement comes later.
Between those stages, clearing organizes the transactions and determines the obligations that must be delivered. Where the system permits, offsetting can reduce gross activity into the obligations that proceed to settlement.
That process means traded volume and settled volume should not automatically be expected to match share for share.
Verified fact and interpretation
Verified fact: settled share volume was 49.10% of reported traded share volume.
Not supported by this ratio alone: that 50.90% of trades defaulted, failed delivery, or represented speculation.
Why the value ratio was higher
Volume treats every share as one unit. Value weights each share by its rupee amount.
A market can therefore show a lower settlement ratio by shares and a higher ratio by value when the composition of the settled obligations differs from the composition of gross traded shares.
The difference between 49.10% by volume and 56.26% by value is not itself an error. It is a reminder to check whether a percentage refers to shares or rupees.
What supports the interpretation
- The source reports separately identify trading and settlement.
- Volume and value are published as distinct series.
- Clearing sits between execution and settlement in the market process.
- The two ratios are calculated directly from the corresponding official figures.
What weakens or limits the interpretation
The ratio alone does not explain every component of the gap. A precise breakdown requires the exact report methodology, aggregation level, and the treatment of offsetting and other market processes.
Risk and limitation
Do not use the difference between 100% and the settlement ratio as a failed-trade estimate. That would attach a meaning the dataset does not establish.
Open questions on the series
- Whether the volume ratio stays near 49% across additional sessions.
- Whether the value ratio continues to exceed the volume ratio.
- Whether NCCPL publishes more detail on the construction and aggregation of the series.
- Whether UIN-wise and clearing-member-wise views produce different totals and why.
Sources & notes
- NCCPL market-wide trade-versus-settlement volume report, 29 July 2026
- NCCPL market-wide trade-versus-settlement value report, 29 July 2026