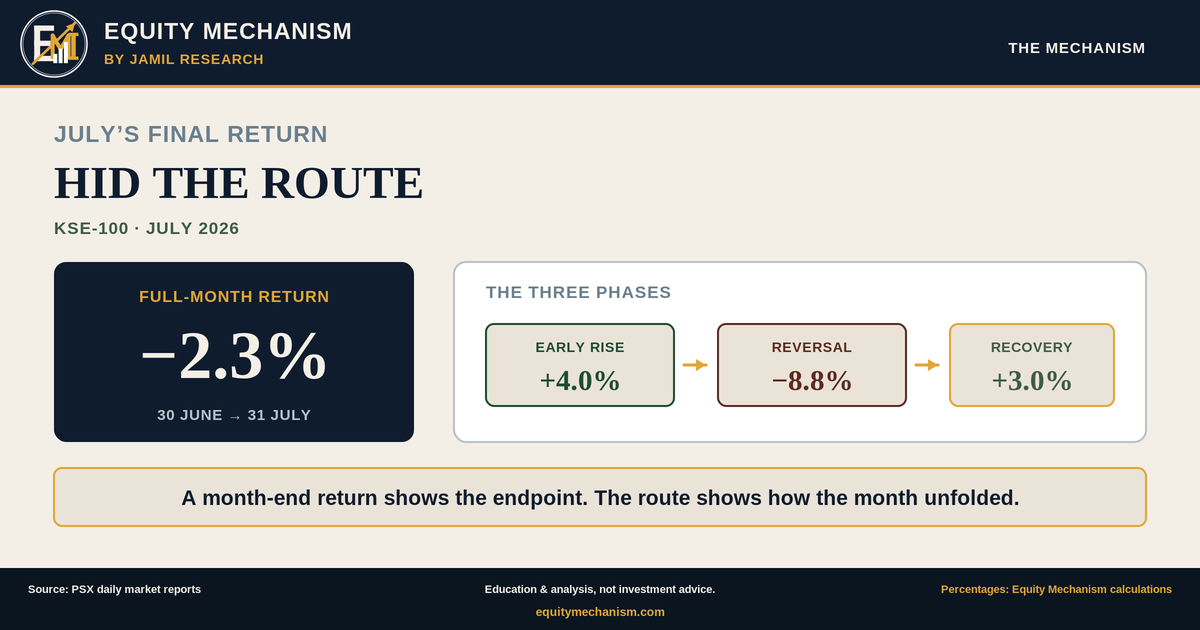
The KSE-100 ended July 2026 at 176,094.12, about 2.3% below its 30 June close of 180,301.70.
That month-end return is correct. It is also incomplete on its own.
July did not move through one continuous decline. The index first rose, then reversed more sharply, then recovered part of the loss before the month ended.
- The KSE-100 rose 4.0% from 30 June to 6 July.
- It then fell 8.8% from 6 July to 24 July.
- It recovered 3.0% from 24 July to 31 July, leaving the full-month return at −2.3%.
All percentages are Equity Mechanism calculations from the approved closing levels.
The four closes behind the monthly return
| Stage | Closing level | Change |
|---|---|---|
| 30 June starting point | 180,301.70 | Baseline |
| 6 July | 187,454.69 | +4.0% from 30 June |
| 24 July | 171,021.20 | −8.8% from 6 July |
| 31 July | 176,094.12 | +3.0% from 24 July |
| Full month | 176,094.12 | −2.3% from 30 June |
Starting close → early-month rise → larger reversal → partial recovery → month-end return
Why the route matters
A monthly return compresses every move between the starting and ending dates into one percentage.
That makes the return useful for comparing endpoints. It does not show the experience between those endpoints.
Two months can finish with the same return but expose investors to different conditions:
- one may move gradually while another swings sharply;
- one may recover quickly while another remains near its low;
- one may be driven by broad participation while another depends on a few large companies;
- one may show sectors moving together while another contains strong rotation;
- one may have stable liquidity while another has uneven activity.
This is a form of path dependency: the route taken can matter even when the final percentage is the same.
What July's path shows
The approved closing sequence separates July into three phases.
Phase 1: early advance
The KSE-100 moved from 180,301.70 on 30 June to 187,454.69 on 6 July.
That was a gain of approximately 4.0%.
Phase 2: larger reversal
From 6 July to 24 July, the index fell to 171,021.20.
That was a decline of approximately 8.8%, larger than the opening rise.
Phase 3: partial recovery
From 24 July to 31 July, the index recovered to 176,094.12.
That was a gain of approximately 3.0%, enough to regain part of the reversal but not enough to return to the 30 June starting point.
Verified facts
The four approved closing levels and the calculated percentage changes show an early advance, a larger reversal and a partial recovery.
Named inference
July's final loss was not produced through one continuous decline. It was the net result of those three phases.
What the data does not establish
The closing path alone does not identify which sectors or companies generated each phase. It also does not explain why investor positioning changed.
What supports this reading
The mechanism is based on exact closing points rather than an impression from a chart.
The calculation also avoids relying on incomplete monthly participant-flow totals. The missing 27 and 28 July participant records matter for any claim about monthly buying or selling, but they do not change the four approved KSE-100 closes used here.
The result is a narrow conclusion:
the month-end return hides a non-linear route.
What weakens or limits the reading
Closing data is not the full market record.
It does not capture every intraday move. It does not show how many stocks contributed to each phase. It does not identify sector leadership, index-point contribution, liquidity quality or participant behaviour.
Those questions require separate evidence.
Interpretation risk
A reader may mistake the late-July recovery for proof that the earlier reversal has ended.
The closing path does not provide that confirmation. It only shows that the index recovered part of the decline by 31 July.
Falsifier
This calculation must be updated if the Pakistan Stock Exchange corrects any of the four closing levels used in the analysis.
- Whether early-August trading extends or reverses the late-July recovery.
- Whether more stocks participate or activity remains concentrated.
- Whether sector indices move together or continue to diverge.
- Whether complete participant-flow data confirms or contradicts the index direction.
Sources & notes
- Pakistan Stock Exchange daily market reports for 30 June, 6 July, 24 July and 31 July 2026, as represented in the approved July handoff.
- Equity Mechanism calculations from the four closing levels.
- Source limitation: primary report URLs were not embedded in the production runtime.