- Tickers
- UBL, FFC, HBL, ENGROH, PPL
One-sentence thesis
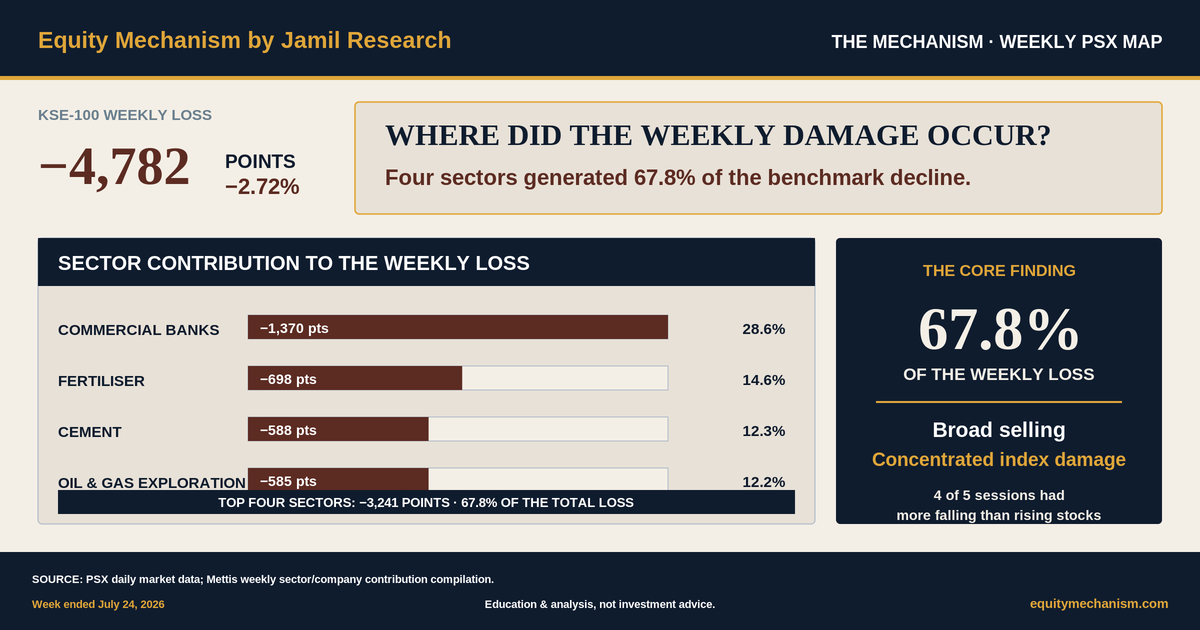
The week’s selling reached many shares, but the KSE-100’s point loss was not evenly distributed: four heavyweight sectors generated nearly 68% of the benchmark decline.
- The KSE-100 fell from 175,802.79 to 171,021.20, a weekly loss of 4,781.59 points or 2.72%.
- Commercial banks, fertiliser, cement, and oil and gas exploration companies generated 3,240.69 negative points, equal to 67.8% of the total loss.
- UBL, FFC, HBL, ENGROH and PPL together accounted for 37.9% of the benchmark decline.
- Declining stocks outnumbered advancing stocks in four of five sessions, so the weakness was broader than only a handful of large companies.
- The All-Share Index fell about 2.56%, slightly less than the KSE-100, indicating that heavyweight shares experienced somewhat greater damage than the wider market.
- The result is a concentration map, not a prediction. It shows where index points were lost during one week.
Mechanism sequence
- Broad risk reduction
- More stocks fall than rise
- Heavier pressure develops in large index sectors
- A few heavyweight companies remove disproportionate index points
- The KSE-100 falls slightly more than the broader market
The headline and the hidden question
The KSE-100 ended the week of July 24, 2026 at 171,021.20, down 4,781.59 points or 2.72% from the previous Friday. That tells us how far the benchmark moved.
It does not tell us:
- whether the decline was spread evenly across the market;
- which sectors removed the most index points;
- whether a few large companies dominated the damage; or
- whether smaller and mid-sized shares performed differently from the main benchmark.
Those questions matter because the KSE-100 is not an equal-weighted count of companies. A large index constituent can affect the benchmark far more than a smaller listed company. The number of falling shares and the number of index points lost therefore measure different parts of the same week.
At a glance
| Measure | Week ended July 24, 2026 | What it tells us |
|---|---|---|
| KSE-100 change | −4,781.59 points / −2.72% | Size of the benchmark decline |
| Top four sector contribution | −3,240.69 points / 67.8% | Where most index damage was concentrated |
| Top five company contribution | −1,811.74 points / 37.9% | How much a small group of heavyweights mattered |
| Sessions with more falling than rising stocks | 4 of 5 | Weakness reached the wider market |
| All-Share weekly change | approximately −2.56% | Broader market fell slightly less than the KSE-100 |
Layer one: selling was broad
The first test is simple: how many stocks rose and how many fell?
Declining stocks outnumbered advancing stocks on Monday, Wednesday, Thursday and Friday. Tuesday was the only session in which advancing stocks led.
That evidence rules out an overly narrow explanation such as “only two or three heavyweight shares fell.” The wider market was under pressure too.
Thursday was especially broad. The daily market summary reported 91 rising stocks and 372 falling stocks, while 91 of the 100 KSE-100 companies also closed lower.
The broad-market evidence is important because a concentration analysis can otherwise be misread. Saying that four sectors produced 67.8% of the index loss does not mean the remaining market was healthy. It means the selling reached many shares, but the largest point damage accumulated in a smaller set of heavyweights.
Layer two: four sectors caused most of the benchmark damage
The weekly sector contribution compilation shows the following four sectors as the largest drags:
| Sector | Negative contribution | Share of total weekly KSE-100 loss |
|---|---|---|
| Commercial Banks | −1,369.54 points | 28.6% |
| Fertiliser | −697.75 points | 14.6% |
| Cement | −588.07 points | 12.3% |
| Oil & Gas Exploration Companies | −585.33 points | 12.2% |
| Combined | −3,240.69 points | 67.8% |
Commercial banks alone generated negative contribution equal to 28.6% of the complete weekly benchmark decline.
The other three leading sector drags were much smaller individually, but together they added another 39.1 percentage points to the concentration. That is why the combined figure reaches almost 68%.
This is the central mechanism:
The market sold off broadly, but the index is weighted. Larger companies in larger sectors converted that selling into a disproportionate number of negative benchmark points.
Why banks mattered most
The sector table describes where the benchmark lost points. It does not, by itself, prove one common cause for every bank share.
Commercial banks can react to several overlapping considerations, including interest-rate expectations, bond-portfolio valuations, funding conditions, credit growth, asset quality and company-specific results. Different banks can move for different reasons during the same week.
The verified finding is narrower and stronger:
Commercial banks were the single largest source of negative KSE-100 contribution during the week.
Any deeper explanation should be tested against bank filings, policy expectations and company-level disclosures rather than assumed from the sector total alone.
The company layer: five names generated nearly 38% of the loss
The five largest negative constituent contributions were:
| Company | Negative contribution | Role in the concentration |
|---|---|---|
| UBL | −593.85 points | Largest single-company drag |
| FFC | −512.86 points | Largest fertiliser drag in the top five |
| HBL | −255.47 points | Second large bank contribution |
| ENGROH | −246.28 points | Large diversified holding-company drag |
| PPL | −203.28 points | Major exploration-sector drag |
| Combined | −1,811.74 points | 37.9% of the weekly loss |
UBL alone accounted for negative contribution equal to about 12.4% of the entire weekly KSE-100 decline. UBL and FFC together represented more than 23%.
This is why a benchmark can fall sharply even when some smaller shares or sectors hold up better. A few very large constituents can remove hundreds of points each.
The company table should not be read as a ranking of “bad companies.” It is a measurement of index contribution over a specific week. The figures combine share-price movement with index weight. They do not replace an assessment of earnings, balance sheets, valuation or long-term business quality.
Verified fact, named evidence and inference
Verified facts
- The KSE-100 fell 4,781.59 points or 2.72% during the week.
- The All-Share Index ended July 24 at 103,836.38.
- More stocks fell than rose in four of the five sessions.
Named secondary evidence
- Mettis’s weekly compilation attributes 67.8% of the benchmark loss to the four leading sector drags.
- The same compilation attributes 37.9% of the loss to UBL, FFC, HBL, ENGROH and PPL.
Named inference
Inference: The KSE-100’s slight underperformance versus the All-Share Index is consistent with heavier pressure in large index constituents.
Why it remains an inference: The two indices use different constituent sets and weighting structures. Their weekly difference is informative, but it does not independently prove the cause of every stock move.
The broader-market cross-check
The All-Share Index fell from approximately 106,568.28 to 103,836.38, a weekly decline of about 2.56%.
That was slightly less than the KSE-100’s 2.72% decline.
The difference is not large enough to claim that the broader market was resilient. It was not. Daily rising-versus-falling-stock counts show widespread weakness.
But the difference supports a more precise statement:
The sell-off was broad, while heavyweight KSE-100 constituents experienced somewhat greater damage than the wider market.
This is more useful than either extreme:
- “Only a few large shares fell” would ignore the broad selling.
- “Every part of the market fell equally” would ignore the sector and company concentration.
Both breadth and concentration can exist at the same time.
What supports this reading
- Four of five sessions had more falling than rising stocks.
- The All-Share Index also declined materially.
- Commercial banks were the largest sector drag by a wide margin.
- The top four sectors generated more than two-thirds of the KSE-100 loss.
- Five heavyweight companies generated almost two-fifths of the loss.
- Daily sector and constituent contribution reports broadly reconcile with the weekly compilation, subject to rounding.
What weakens or limits the reading
- Sector contribution explains index-point location, not the complete economic cause.
- One week is a short observation window.
- Company contributions depend on both price movement and index weight.
- The All-Share comparison is close; it shows relative pressure, not a dramatic market split.
- Later sessions can quickly change the concentration map.
- A secondary weekly contribution compilation is used because an equivalent official PSX weekly contribution table was not included in the available source package.
The main risk is turning a descriptive map into a directional forecast. A concentrated weekly loss does not guarantee that the same sectors will lead the next decline or rebound. It also does not establish that all companies inside a sector face the same underlying mechanism.
A second risk is confusing index contribution with business quality. A large negative contribution can arise because a company has a high index weight, not because its fundamentals deteriorated by an equivalent proportion.
What would change the view
The concentration pattern would change if:
- banks, fertiliser, cement and exploration stabilise while weakness rotates into other sectors;
- the All-Share Index begins falling materially more than the KSE-100;
- rising stocks start outnumbering falling stocks while the benchmark remains weak; or
- positive heavyweight contributions begin offsetting broader weakness.
Those outcomes would not erase the July 17–24 evidence. They would show that the market mechanism had moved into a new phase.
Six checks for the week ahead
- Sector contribution: Do commercial banks remain the largest source of index movement?
- Company contribution: Do UBL, FFC, HBL, ENGROH and PPL continue to dominate the point map?
- How many stocks rise or fall: Does daily participation improve even if the index remains volatile?
- KSE-100 versus All-Share: Does the performance gap widen, narrow or reverse?
- Rotation: Does weakness remain concentrated in the same sectors or move elsewhere?
- Company evidence: Do filings or results provide a company-specific explanation that is stronger than the market-wide narrative?
The reusable lesson
A benchmark headline is an endpoint, not a complete explanation.
A disciplined weekly reading should move through four layers:
- Benchmark move
- How many stocks rose or fell
- Sector contribution
- Company contribution
The first layer tells us how far the index moved. The next three tell us whether the move was broad, concentrated, or both.
For the week ended July 24, 2026, the answer was both:
Selling was broad, but four heavyweight sectors and five large companies caused a disproportionate share of the KSE-100’s damage.
Sources & notes
- Pakistan Stock Exchange Data PortalJuly 24 KSE-100 and All-Share closing levels. PSX is the primary source for market levels and daily participation.
- Pakistan Stock Exchange Daily DownloadsDaily market reports and index/market participation evidence for the week.
- Mettis Weekly Market Roundup, July 25, 2026Named secondary compilation for weekly sector and company point contributions. Concentration percentages are Equity Mechanism calculations from the reported point contributions.