- Data as of
- 2026-08-12 22:50 PKT
- Ticker
- ACPL
- Sector
- cement
The 20-second view
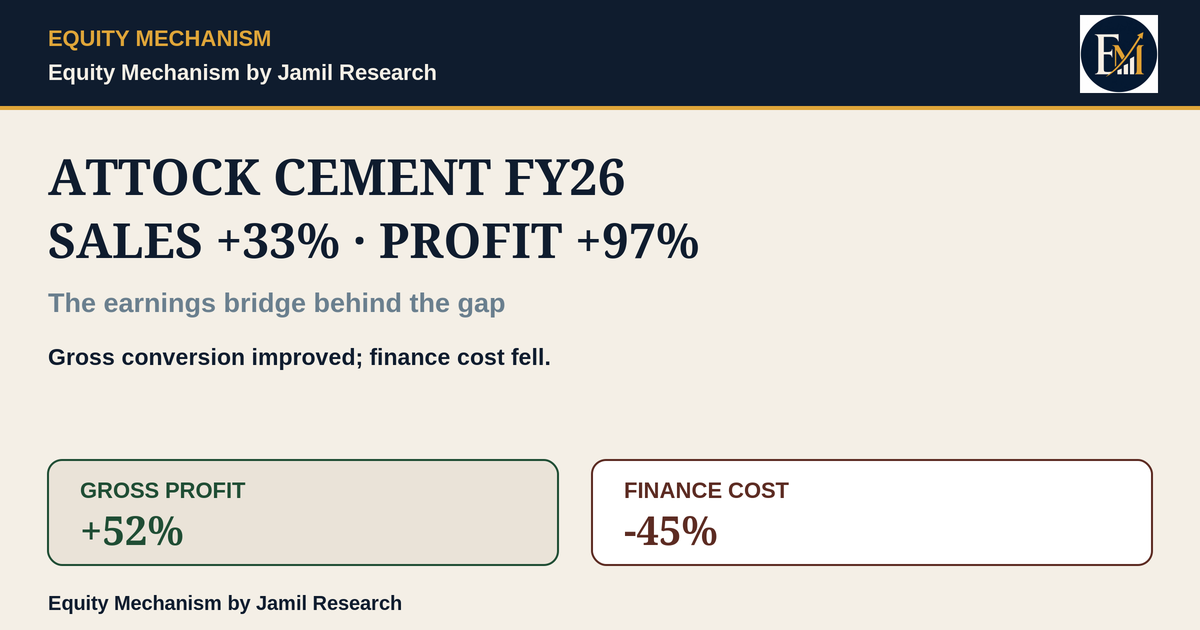
- Finding: Attock Cement Pakistan Limited (ACPL) increased FY26 revenue by 33.1%, but profit after tax rose 97.3%.
- Mechanism: Gross profit grew faster than revenue, part of that gain was absorbed by operating-cost and other-income movements, and a 44.8% fall in finance cost widened the increase below operating profit.
- Why it matters: The result shows why an EPS headline should be traced through the income statement before assigning a cause.
- What could change the reading: The next test is whether the stronger earnings conversion persists when future filings separate recurring operating performance from effects that may not repeat at the same magnitude.
The question this article answers
Attock Cement’s FY26 headline is striking: sales rose by roughly one-third, while profit after tax almost doubled.
That gap is the research question. If revenue increased 33.1%, why did profit after tax increase 97.3%?
The answer is not one line. The FY26 statement of profit or loss shows a multi-stage bridge: stronger gross conversion, operating offsets, then a much lower finance-cost burden before tax.
Company snapshot
Attock Cement Pakistan Limited is a PSX-listed cement manufacturer under ticker ACPL. The company’s fiscal year ends in June.
This article focuses narrowly on the FY26 earnings bridge. It is not a valuation report, price view, recommendation, or full balance-sheet and cash-flow review.
The evidence first
The company’s 11 August 2026 filing to the Pakistan Stock Exchange reported the following:
| PKR million, except EPS | FY26 | FY25 | Change |
|---|---|---|---|
| Revenue | 44,324.6 | 33,309.1 | +33.1% |
| Cost of sales | 32,231.8 | 25,336.3 | +27.2% |
| Gross profit | 12,092.9 | 7,972.8 | +51.7% |
| Distribution costs | 5,080.6 | 3,563.4 | +42.6% |
| Administrative expenses | 1,121.2 | 988.3 | +13.4% |
| Other expenses | 366.2 | 180.8 | +102.5% |
| Other income | 746.8 | 1,433.4 | -47.9% |
| Profit from operations | 6,271.5 | 4,673.7 | +34.2% |
| Finance cost | 1,015.3 | 1,837.7 | -44.8% |
| Profit before tax | 5,277.3 | 2,856.7 | +84.7% |
| Income tax expense | 1,861.0 | 1,125.7 | +65.3% |
| Profit after tax | 3,416.3 | 1,731.1 | +97.3% |
| EPS, PKR | 24.86 | 12.60 | +97.3% |
Verified fact: FY26 revenue rose 33.1%, gross profit rose 51.7%, operating profit rose 34.2%, profit before tax rose 84.7%, and profit after tax rose 97.3%.
Named inference: The earnings acceleration was a multi-stage bridge. Better gross conversion improved the starting point, operating-line offsets prevented all of that benefit from reaching operating profit, and the lower finance-cost burden materially widened growth below the operating line.
The first bridge: revenue grew faster than cost of sales
Revenue increased to PKR44.32bn from PKR33.31bn.
Cost of sales increased to PKR32.23bn from PKR25.34bn, a 27.2% increase that was slower than revenue growth.
That difference pushed gross profit up 51.7% to PKR12.09bn.
Gross margin consequently improved to 27.28% from 23.94%, a gain of about 3.34 percentage points. This is the clearest operating improvement visible in the headline income-statement bridge.
The middle of the bridge: gross-profit growth did not fully reach operating profit
The next step is important because it prevents an over-simple conclusion.
Distribution costs increased 42.6% to PKR5.08bn. Administrative expenses rose 13.4%. Other expenses more than doubled to PKR366m. At the same time, other income fell 47.9% to PKR747m.
Those movements absorbed part of the gross-profit improvement.
Operating profit still increased to PKR6.27bn, but the growth rate was 34.2%. That is much closer to revenue growth of 33.1% than to gross-profit growth of 51.7%.
Calculated operating margin was approximately 14.15% in FY26 versus 14.03% in FY25.
That distinction matters: the result does not show a straight line from higher gross margin to a similarly large expansion in operating margin.
The second bridge: finance cost changed the slope below operating profit
Below operating profit, the income statement changed more sharply. Finance cost fell to PKR1.02bn from PKR1.84bn, a decline of 44.8%.
With operating profit up 34.2% and finance cost materially lower, profit before tax rose to PKR5.28bn from PKR2.86bn, an increase of 84.7%.
Calculated PBT margin rose to approximately 11.91% from 8.58%.
This is where the gap between top-line growth and pre-tax profit growth becomes much larger.
The filing confirms the finance-cost decline. This article does not assign a cause to that decline unless the issuer’s detailed disclosures directly support it.
Tax increased, but PAT still nearly doubled
Income tax expense rose 65.3% to PKR1.86bn. Even after that higher tax charge, profit after tax reached PKR3.42bn versus PKR1.73bn.
Net margin improved to 7.71% from 5.20%, while EPS increased to PKR24.86 from PKR12.60.
The final result is therefore consistent with a bridge in which:
Earnings bridge: Revenue growth → stronger gross-profit conversion → operating offsets → lower finance cost → faster profit-before-tax growth → higher tax → PAT +97.3%.
What the headline can hide
“Profit nearly doubled” is accurate, but incomplete.
It can hide three different questions:
-
Was the improvement operating? Partly. Gross margin improved, but operating margin was broadly stable because other operating lines absorbed much of the gross-profit gain.
-
Did below-operating items matter? Yes. The fall in finance cost materially widened the increase from operating profit to profit before tax.
-
Does FY26 tell us what will happen next? No. A historical income statement explains what changed; it does not guarantee persistence.
Alternative interpretation
A reader could focus only on the improved gross margin and conclude that operating efficiency explains most of the PAT increase. The operating-profit bridge weakens that interpretation.
Operating profit grew 34.2%, close to revenue growth, because higher distribution and other expenses and lower other income offset part of the gross-profit expansion.
That makes the below-operating finance-cost movement important to the final PAT growth rate.
Risks, limits, and falsifiers
- Data limitation: This article uses the FY26 result filing and verified PSX company data. It is not a substitute for a complete annual-report review.
- Scope limitation: Balance-sheet leverage, debt maturity, cash-flow quality and segment-volume drivers are not fully assessed here.
- Alternative driver: Future detailed disclosures may show that specific recurring or non-recurring items deserve more weight than this headline bridge can establish.
- Falsifier: If subsequent annual-report detail changes the classification or recurring nature of major FY26 income-statement effects, the interpretation should be updated.
What the FY26 annual report should confirm
The next research step is the full FY26 annual report and subsequent quarterly reporting.
Watch whether:
- gross margin remains above the FY25 level;
- distribution-cost growth moderates relative to revenue;
- other income normalises;
- finance cost remains materially below the FY25 level;
- operating profit begins to grow faster than revenue rather than merely tracking it.
Method and calculations
Reported figures are taken from Attock Cement Pakistan Limited’s FY26 financial-result filing to PSX for the year ended 30 June 2026.
Growth rates are calculated as (FY26 / FY25 − 1) × 100.
Margins are calculated as profit line / revenue × 100.
Values shown in billions or millions are rounded for readability. The underlying filing reports values in PKR thousands except EPS.
No share-price performance, valuation multiple, target price, entry/exit level or expected return is used in this analysis.