- Data as of
- 2026-08-06 21:14 PKT
The 20-second view
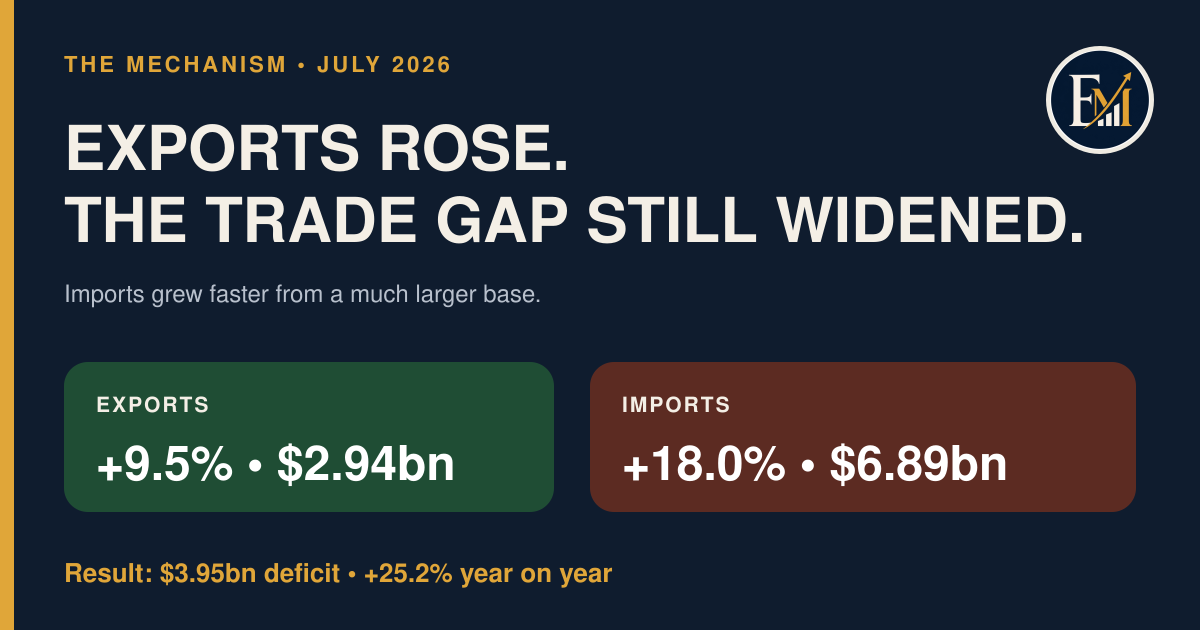
- Finding: Pakistan’s merchandise exports rose 9.5% year on year to about $2.94bn in July 2026, yet the trade deficit widened 25.2% to about $3.95bn.
- Mechanism: Imports began from a much larger base and rose 18.0%. Their dollar increase of about $1.05bn was far larger than the roughly $256m export gain.
- Why it matters: A better export headline does not by itself improve the trade balance. Both sides, their starting bases and the comparison period control the reading.
- What could change the reading: July is provisional, one FBR stream was awaited, and the detailed commodity mix is needed before drawing strong sector or company conclusions.
The question this article answers
How can exports improve while the trade deficit gets worse?
The answer is not hidden in a complicated model. It is in the arithmetic of two unequal starting points. Exports rose, but imports were already more than twice as large and then grew faster.
The evidence first
| Provisional merchandise trade | July 2025 | July 2026 | Year-on-year change |
|---|---|---|---|
| Exports | $2.68bn | $2.94bn | +9.5% |
| Imports | $5.84bn | $6.89bn | +18.0% |
| Trade deficit | $3.15bn | $3.95bn | +25.2% |
Verified fact: PBS reported higher exports, higher imports and a wider merchandise-trade deficit in July 2026 than in July 2025.
Named inference: The wider goods gap can add external-financing and currency pressure if remittances, services, income flows or financing do not offset it. This is a conditional interpretation, not a claim that the current account must deteriorate by the same amount.
The hidden mechanism: dollar changes beat headline percentages
The trade balance is imports minus exports. The direction of one line is not enough.
Using the source figures behind the rounded public values:
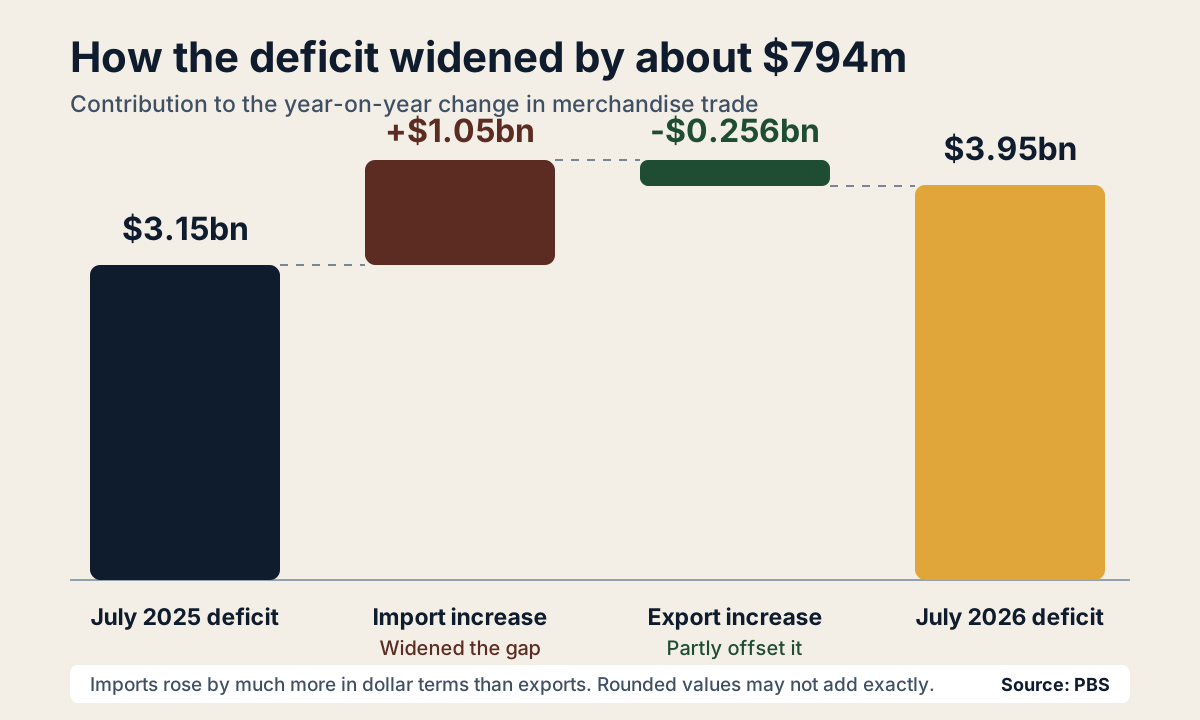
That approximate $794m imbalance between the two changes explains why the deficit moved from roughly $3.15bn to $3.95bn.
The export improvement was real. It was simply not large enough to offset the increase on the much larger import side.
The comparison period changes the message
July looks different when compared with June 2026:
- exports rose 31.1% month on month;
- imports slipped 0.2%;
- the deficit narrowed 15.2% to about $3.95bn.
Both readings are valid:
| Question | Answer |
|---|---|
| Was July better than June 2026? | Yes, on the provisional monthly comparison. |
| Was July better than July 2025? | No, the provisional deficit was 25.2% wider. |
Month-on-month data show the latest direction. Year-on-year data control for part of the seasonal calendar. Neither should be used alone.
How the mechanism can reach PSX
The headline deficit is a macro signal. The path into listed companies depends on what Pakistan imported and why.
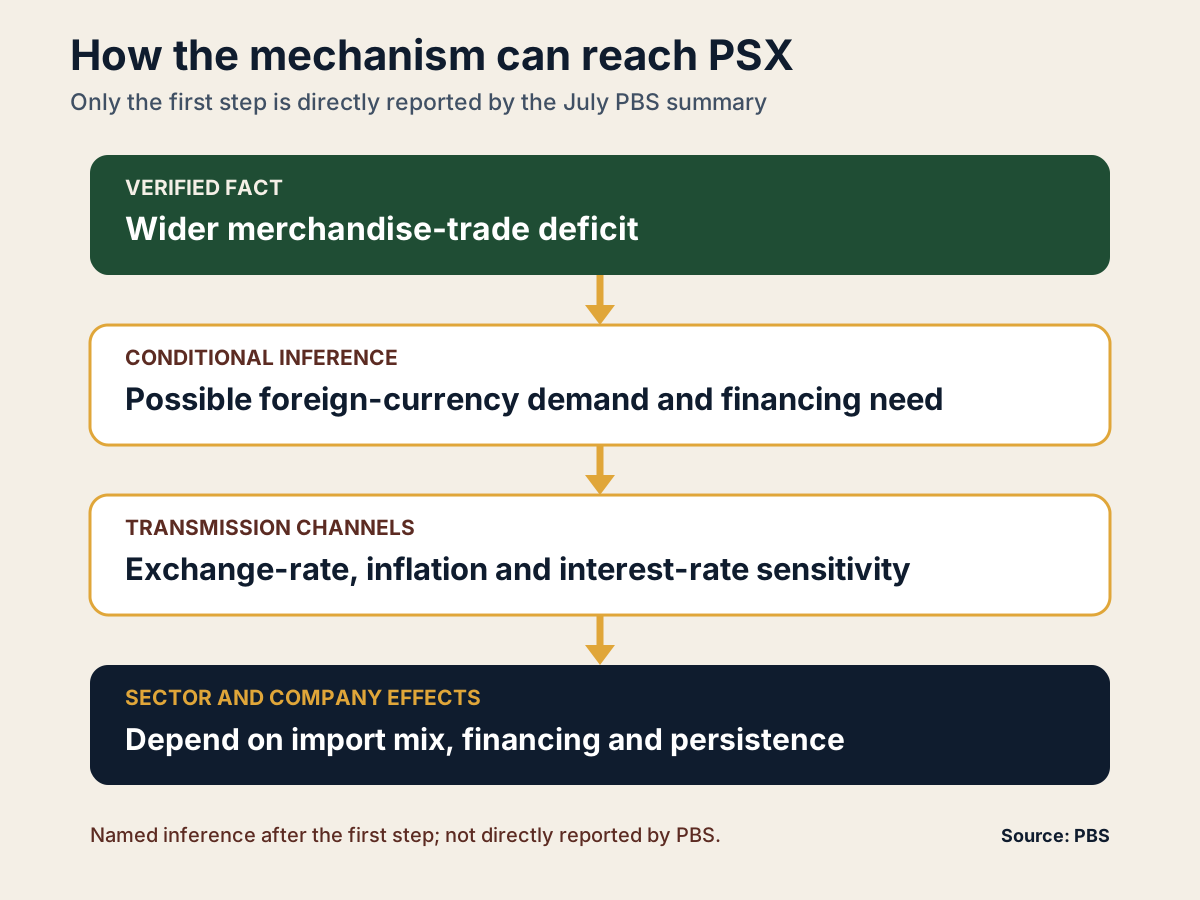
The steps after the goods gap are inference, not direct facts from the July summary.
- Energy imports can transmit through fuel costs, power costs, inflation and working capital.
- Machinery imports can signal investment and future capacity rather than only immediate pressure.
- Industrial inputs can support production while also raising near-term import payments.
- Consumer-goods imports can affect domestic competition and demand leakage.
Without the detailed July commodity mix, the responsible conclusion stops at the mechanism map. It does not force a sector winner, company loser or investment action.
The strongest alternative interpretation
A wider trade deficit is not automatically evidence of weaker economic quality. Imports can rise because firms are purchasing machinery, raw materials or intermediate goods that support production. The same headline can therefore contain both near-term external pressure and future productive capacity.
The composition, financing and persistence of the increase decide which reading is stronger.
Risks, limits and falsifiers
- Provisional data: July figures can be revised.
- Awaited stream: one FBR input was still awaited in the approved source record.
- Scope: merchandise trade is not the current-account balance; services, income and transfers matter.
- Time: one month is a signal, not a trend.
- Composition: detailed product data are needed for firm sector conclusions.
- Falsifier: if later revisions materially reduce the import increase or the deficit, the size of this mechanism must be recalculated.
The next releases that test this
- PBS’s detailed July import and export mix.
- Energy imports versus machinery and industrial inputs.
- SBP’s July current-account, reserve and payment/receipt data when released.
- Whether August repeats, reverses or broadens the gap.
Method and calculations
The article uses PBS’s provisional July 2026 merchandise-trade summary. Public dollar values are rounded to two decimal places in billions. The approximate $256m, $1.05bn and $794m changes are calculations from the source figures used in the approved production record; rounding means displayed values may not add exactly.
Year-on-year compares July 2026 with July 2025. Month-on-month compares July 2026 with June 2026. No services balance, remittance flow or current-account figure is combined with the merchandise data.
Sources & notes
- Pakistan Bureau of Statistics — Monthly Summary on Foreign Trade Statistics for July 2026
- Pakistan Bureau of Statistics — Summary July 2026 workbook
- State Bank of Pakistan — official data calendarUsed only to identify later July external-sector releases to watch.