- Data as of
- 2026-08-16 16:34 PKT
- Ticker
- PRL
The 20-second view
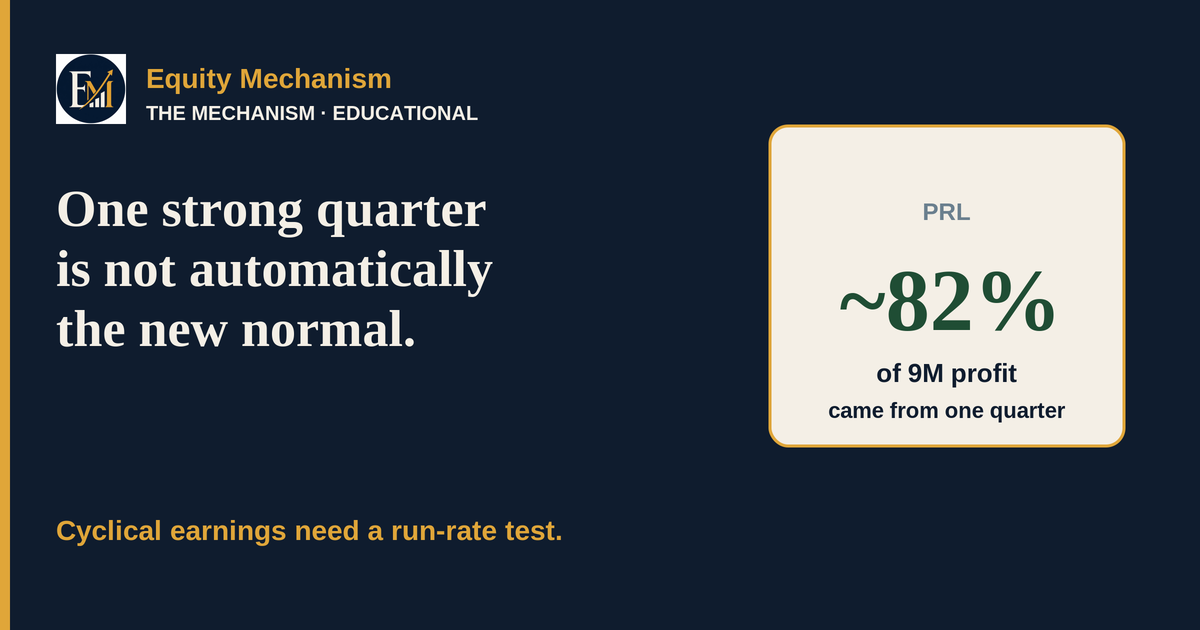
- Finding: Pakistan Refinery Limited reported Rs9.94bn profit after tax in the March 2026 quarter and Rs12.08bn for the first nine months of FY26. The quarter therefore contributed about 82.3% of nine-month profit, calculated from the reported figures.
- Mechanism: Refinery spreads, operating efficiency and volatile input conditions can move margins sharply, which can make one quarter dominate recent earnings.
- Why it matters: A strong cyclical quarter can be fully real while still being a weak basis for an automatic annual earnings run-rate.
- What could change the reading: Future product spreads, utilisation/volumes, input and freight costs, finance costs, policy/tax effects and working-capital conditions.
The question this article answers
A company reports a spectacular quarter. Should we multiply that quarter by four and call it the new earning power?
For a cyclical business, that shortcut can be dangerous.
PRL provides a clean numerical example. The March 2026 quarter produced most of the company's profit for the first nine months of FY26. The result is verified. The interpretation still requires a mechanism.
The evidence first
PRL's unaudited interim statement for the nine months ended March 31, 2026 reported:
| Measure | 9M FY26 | March 2026 quarter |
|---|---|---|
| Revenue | Rs234.40bn | Rs97.39bn |
| Gross profit | Rs25.49bn | Rs18.88bn |
| Operating profit | Rs23.27bn | Rs17.23bn |
| Profit after tax | Rs12.08bn | Rs9.94bn |
The comparative March 2025 quarter recorded a Rs2.58bn loss after tax.
Verified fact: PRL reported Rs12.079854bn profit after tax for the nine months ended March 31, 2026 and Rs9.942503bn for the March quarter.
Calculated fact: Rs9.942503bn divided by Rs12.079854bn equals 82.3%. In other words, roughly four-fifths of nine-month profit came from one quarter.
Named inference: That concentration is a reason to test whether the quarter represents repeatable earning power. It is not proof that earnings must fall.
The correct definition: a run-rate is an assumption
A quarterly result is an observation.
A run-rate is an assumption about what could repeat.
If an analyst simply multiplies a quarter's profit by four, the calculation silently assumes that the economic conditions behind that quarter persist. For a stable business, that may sometimes be a useful rough starting point. For a cyclical business, the assumption deserves much more scrutiny.
A refinery's profitability can change with the relationship between crude input costs and the value of refined products, operating conditions, freight and insurance costs, financing conditions, and policy or tax treatment.
The mechanism
one quarter → temporary operating conditions → reported earnings → investor interpretation
product crack spreads + operating efficiency + input conditions
→ gross margin
→ operating profit
→ quarterly PAT
→ trailing / annualised earnings
→ valuation and “normal earnings” interpretation
PRL's Directors' Review says that significant global oil-price volatility affected margins as well as freight and insurance costs during the period. It also says that, combined with operational efficiencies and improved product crack spreads, the company recorded Rs12.1bn profit after tax for the nine months.
That does not mean every rupee of profit can be attributed to one variable. It does establish that the period's earnings sat inside a changing refinery-margin environment rather than a fixed-margin business model.
A simple numerical example
Suppose someone annualised only the March-quarter PAT:
Rs9.942503bn × 4 = Rs39.77bn
That is arithmetic, not a forecast.
It assumes that a quarter which contributed 82.3% of nine-month profit can repeat four times under comparable conditions. The filing does not establish that assumption.
A more disciplined reading is:
- record the verified quarter;
- identify the operating and cyclical drivers;
- compare multiple periods;
- test cash flow and balance-sheet conditions;
- then form a named view about normalised earnings.
What the headline can hide
The nine-month headline is strong: Rs12.08bn PAT versus a Rs4.59bn loss in the comparative nine-month period.
But the route matters.
The March quarter alone generated:
- Rs18.88bn gross profit out of Rs25.49bn for nine months;
- Rs17.23bn operating profit out of Rs23.27bn for nine months;
- Rs9.94bn PAT out of Rs12.08bn for nine months.
This concentration shows why “profit improved” and “the latest quarter is the new normal” are not the same statement.
Cash flow is a useful cross-check, not a shortcut
PRL reported Rs17.70bn net cash generated from operating activities for the nine months, compared with cash used in operations in the comparative period. That is important evidence that the period's accounting profit was accompanied by positive operating cash flow.
But the balance sheet also changed materially. At March 31, 2026:
- inventories were Rs45.23bn versus Rs22.03bn at June 30, 2025;
- trade receivables were Rs33.17bn versus Rs19.39bn;
- cash and bank balances were Rs6.08bn versus Rs2.84bn.
PRL's Directors' Review separately says delayed government reimbursements were placing strain on liquidity and working-capital management.
The lesson is not to replace profit with cash flow. It is to read profit, cash flow and working capital together.
The common interpretation error
A high quarterly EPS or profit growth rate can create a false sense of permanence when the underlying business is cyclical.
The error usually follows this sequence:
strong quarter
→ annualise immediately
→ treat annualised number as normal earnings
→ compare price with an earnings number that may sit near a cyclical high
The better process inserts a normalisation test before the last step.
How readers can verify it
When a cyclical company reports an unusually strong quarter:
- Open the official quarterly filing.
- Compare the quarter with the cumulative period.
- Calculate what percentage of cumulative profit came from the latest quarter.
- Read the Directors' Review for management's stated operating drivers.
- Compare gross profit and operating profit, not just PAT.
- Check operating cash flow.
- Check inventory, receivables, borrowing and other working-capital movements.
- Review several periods before treating the latest quarter as a sustainable run-rate.
Alternative interpretation
A strong quarter can also mark a genuine structural improvement. For example, persistent efficiency gains, upgraded capacity, better product mix, structurally improved policy economics or a durable change in financing costs could raise normal earning power.
That is why the correct conclusion is not “the quarter will reverse.”
The correct conclusion is narrower:
one quarter is insufficient evidence by itself to define through-cycle earning power.
Risks, limits, and falsifiers
- Data limitation: This case uses an unaudited interim period, not a completed full-year cycle.
- Scope limitation: PRL is one refinery; the same drivers and sensitivities do not apply identically to every cyclical company.
- Alternative driver: Operational improvements may prove more persistent than a simple “cyclical spike” interpretation suggests.
- Falsifier: If subsequent periods sustain comparable margins and earnings under less favourable spread conditions, the argument that the March quarter was unusually cycle-dependent would weaken.
- Liquidity risk to watch: PRL itself highlights delayed reimbursement claims as a strain on liquidity and working-capital management.
What the next filing should show
For the next filing, watch:
- product crack spreads and management commentary on margins;
- throughput / utilisation and operational efficiency;
- inventory and trade-receivable movements;
- operating cash flow;
- finance costs and borrowing;
- policy/tax developments and government receivable recoveries.
The research question is not whether the March quarter was “good” or “bad.” It is whether the drivers behind it persist strongly enough to change normal earning power.
Method and calculations
All company financial figures are taken from PRL's Nine Months Report March 31, 2026 and converted from rupees thousand into rupees billion for readability.
Calculated concentration:
March-quarter PAT / nine-month PAT × 100
= 9.942503 / 12.079854 × 100
= 82.306%
≈ 82.3%
The percentage is calculated by Equity Mechanism and is not a figure reported by PRL.
The illustrative Rs39.77bn annualised figure is simply Rs9.942503bn × 4. It is included to demonstrate the annualisation assumption, not as a forecast, estimate or valuation input.
Sources & notes
- Pakistan Refinery Limited — Nine Months Report March 31, 2026, including Directors' Review, Condensed Interim Statement of Financial Position, Condensed Interim Statement of Profit or Loss and Other Comprehensive Income, and Condensed Interim Statement of Cash Flows. Directors' Review dated April 21, 2026.
- Pakistan Stock Exchange — PRL company/disclosure page, used to confirm listed-company and disclosure context.
Related research
For methodology and source standards, see the Equity Mechanism methodology and source-policy pages. Related educational research should be linked after repository archive review during implementation.