- Data as of
- 2026-08-02 15:15 PKT
- Ticker
- NESTLE
The 20-second view
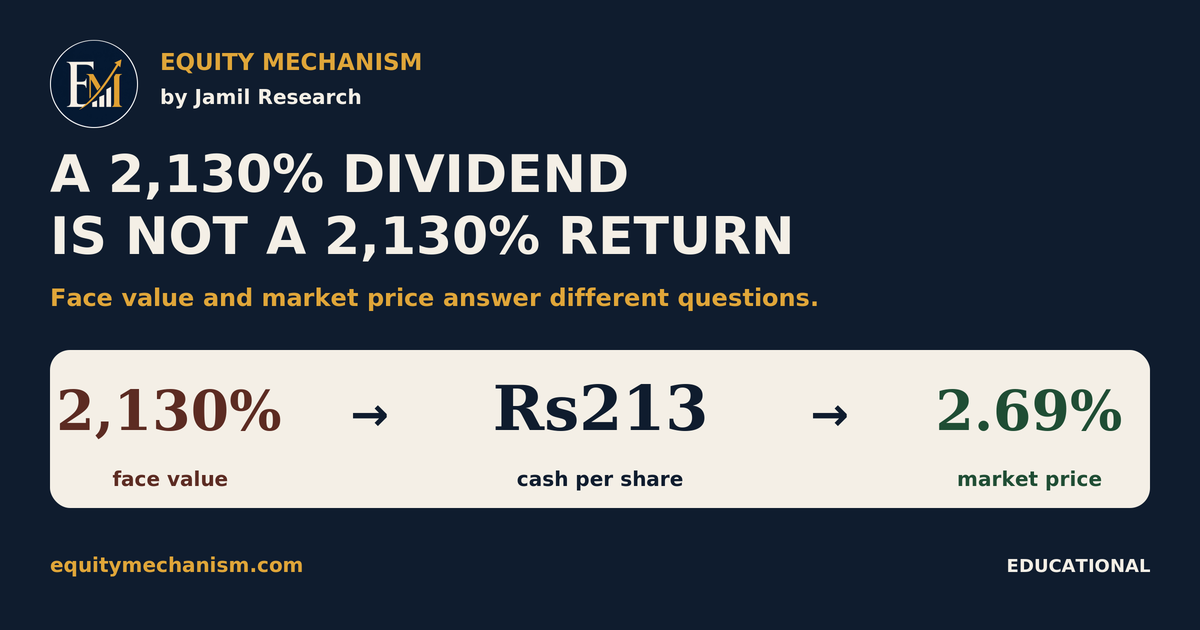
Nestlé Pakistan announced an interim cash dividend of Rs213 per share, stated by the Pakistan Stock Exchange as 2,130%. The four-digit percentage is not an investor’s market return.
The announcement uses the company’s Rs10 share face value as the denominator:
Rs213 ÷ Rs10 × 100 = 2,130%
A simple dividend yield uses a market price instead. At Nestlé Pakistan’s Rs7,913.37 closing price on 31 July 2026, the same Rs213 equals approximately 2.69%. That is a calculated point-in-time comparison, before tax, for this one interim dividend, and it is not annualised.
Why the headline number creates confusion
A percentage is incomplete until its denominator is known.
“2,130%” looks like a return because investment performance is often discussed in percentages. But the PSX announcement is not comparing the dividend with the price an investor paid. It is expressing the cash dividend relative to the share’s face value.
That is why both of these statements can be true at the same time:
| Question | Formula | Result |
|---|---|---|
| How large is the dividend relative to face value? | Rs213 ÷ Rs10 × 100 | 2,130% |
| How large is the dividend relative to the 31 July market close? | Rs213 ÷ Rs7,913.37 × 100 | 2.69% |
The cash amount is unchanged. The denominator changes.
Verified fact versus calculated interpretation
Verified fact: Nestlé Pakistan’s board approved an interim cash dividend of Rs213 per share, stated as 2,130%, in the company’s financial-results announcement disseminated by PSX on 23 July 2026.
Verified fact: Nestlé Pakistan’s official financial statements identify its ordinary shares as PKR 10 each.
Verified fact: PSX reported a closing price of Rs7,913.37 for Nestlé Pakistan on 31 July 2026.
Named calculation: Rs213 divided by Rs7,913.37 equals 2.691647%, rounded to 2.69%. This is a simple point-in-time yield for one interim dividend. It is not a company-reported return.
Step 1: convert the declaration into cash per share
The announcement already gives the cash amount: Rs213 per share. The 2,130% label can be reconstructed from the Rs10 face value.
A percentage of 2,130% is 21.30 times the base amount:
2,130% = 21.30
21.30 × Rs10 = Rs213
This calculation explains the announcement format. It does not tell an investor how much was earned relative to the market price paid.
Step 2: calculate a market-price yield
A simple dividend yield compares cash per share with a selected market price:
Dividend yield = cash dividend per share ÷ market price × 100
Using the 31 July 2026 PSX close:
Rs213 ÷ Rs7,913.37 × 100 = 2.691647%
Rounded = 2.69%
The market price is not fixed. If the share price changes, this point-in-time yield changes even though the declared cash amount remains Rs213.
Why different investors can calculate different yields
An investor may compare the dividend with the original purchase price rather than the current market price. This is commonly called yield on cost.
| Illustrative purchase price | Cash dividend | Illustrative yield on cost |
|---|---|---|
| Rs6,000 | Rs213 | 3.55% |
| Rs8,000 | Rs213 | 2.66% |
These examples do not change the company’s payout. They show that an investor-specific percentage depends on the investor-specific denominator.
The comparison also explains why two shareholders receiving the same Rs213 per share can report different yields on cost.
Three measures that should not be mixed
1. Dividend declaration percentage
This example expresses the cash dividend as a percentage of the Rs10 face value. It is a declaration convention.
2. Dividend yield
This compares cash per share with a market price. It changes as the market price changes.
3. Payout ratio
This compares dividends with earnings. It requires earnings data and a clearly defined period. Face value and market price are not the denominator.
A fourth measure, total shareholder return, also includes the change in share price. It is not calculated in this article.
What the 2.69% calculation does not tell you
The 2.69% figure is intentionally narrow. It does not establish:
- a full-year or trailing-twelve-month dividend yield;
- an annualised yield;
- an after-tax cash return;
- total shareholder return;
- the dividend payout ratio;
- whether future dividends will be repeated; or
- whether the share is expensive or cheap.
It answers only this question: how large is the Rs213 interim dividend compared with the Rs7,913.37 market close selected for the calculation?
The four-check reading method
When a PSX financial announcement displays a dividend percentage, use this sequence.
Check 1: find the cash amount per share
The rupee amount is the actual declared cash distribution before investor-specific tax treatment. In this case, it is Rs213 per share.
Check 2: verify the face value
The face value explains the declaration percentage. Nestlé Pakistan’s ordinary shares are PKR 10 each.
Check 3: define the comparison price
A current-price yield, ex-dividend-date yield and yield on cost can differ because they use different prices. State the selected price and date.
Check 4: identify the dividend type
This announcement is for an interim dividend. One interim payment should not be silently presented as a full-year dividend stream.
Alternative interpretation
A reader may argue that the 2,130% figure is still useful because it allows comparison with other declarations expressed on the same face-value basis. That is reasonable when the purpose is to compare declaration conventions.
It becomes misleading only when the face-value percentage is treated as if it were an investor’s return on market value. The correct metric depends on the question being asked.
Risks, limits and falsifiers
- Market-price limitation: the 2.69% calculation changes when the selected market price changes.
- Tax limitation: the investor’s net cash receipt may be lower after applicable tax.
- Period limitation: this is one interim dividend, not a full-year series.
- Metric limitation: payout ratio and total return are outside the calculation.
- Falsifier: if the official dividend amount, face value or selected closing price is corrected by the issuer or PSX, the calculated percentages must be refreshed.
The administrative checks that apply here
For this educational example, the relevant checks are administrative and definitional rather than directional:
- the official entitlement and book-closure information;
- the ex-dividend market price if a later comparison is made;
- the company’s future interim or final dividend announcements; and
- whether a future post uses current market price, historical price or yield on cost.
Every reused calculation should state the exact denominator and date.
Method and calculations
All company and market figures come from primary sources. Calculated percentages are rounded to two decimal places.
Declaration percentage:
Rs213 ÷ Rs10 × 100 = 2,130%

Point-in-time simple yield:
Rs213 ÷ Rs7,913.37 × 100 = 2.691647% ≈ 2.69%

Illustrative yield on cost at Rs6,000:
Rs213 ÷ Rs6,000 × 100 = 3.55%

Illustrative yield on cost at Rs8,000:
Rs213 ÷ Rs8,000 × 100 = 2.6625% ≈ 2.66%
No dividend reinvestment, annualisation, price return or tax adjustment is included.
Sources & notes
- Pakistan Stock Exchange — Nestlé Pakistan financial-results announcement, 23 July 2026
- Pakistan Stock Exchange — Daily Stock Market Report, market position as of 31 July 2026
- Pakistan Stock Exchange — closing rates for 31 July 2026
- Nestlé Pakistan official first-quarter 2026 financial report, disseminated through PSX