One-sentence thesis
A broad rise in stock prices can coexist with concentrated trading because “how many stocks rose” and “where shares changed hands” measure different parts of the market.
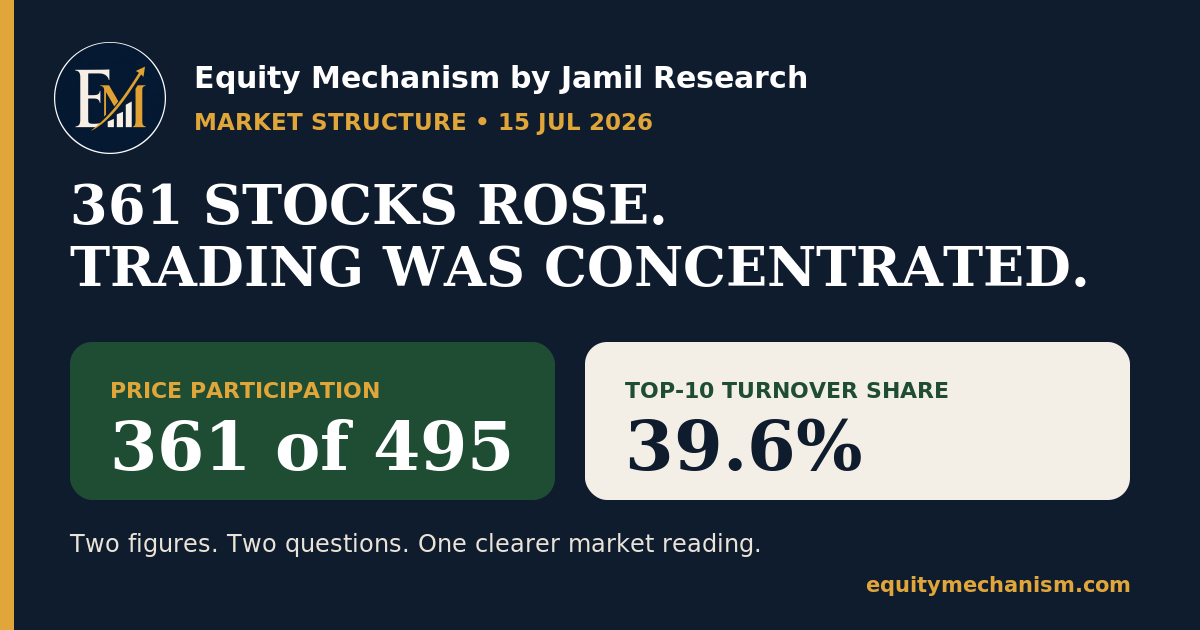
- 361 of 495 ready-market stocks rose: about 73% of companies participated in the rebound.
- The 10 busiest names handled 39.6% of ready-market turnover: 231.2 million of 583.8 million shares.
- Turnover is not index contribution: a stock can trade many shares without being the main driver of the KSE-100.
- The better reading uses three measures together: price participation, turnover concentration and index contribution.
How many stocks rose → where trading clustered → which weighted companies moved the index
What happened
The Pakistan Stock Exchange reported that the KSE-100 rose 1,766.97 points, or 1.02%, to 175,285.78 on 15 July 2026.
The rise was widely spread across the ready market:
- 361 stocks rose
- 104 stocks fell
- 30 stocks were unchanged
- 495 stocks traded in total
That means about 73% of ready-market companies closed higher. But trading activity was not evenly distributed.
The 10 busiest names accounted for 231,228,894 shares, equal to 39.6% of total ready-market turnover of 583,804,947 shares.
Both statements are true:
Most stocks rose, but a large share of trading remained concentrated in a small group.
The two measures answer different questions
1. How many stocks rose?
This tells us how widely price gains were spread.
When 361 of 495 stocks rise, the positive move is not limited to only a few companies. Many stocks participated.
This is a useful measure of price participation.
2. Where was turnover concentrated?
Turnover measures how many shares changed hands.
When 10 names represent 39.6% of turnover, trading activity is clustered even though price gains may be widespread. This is a useful measure of trading concentration.
The mistake is to treat these two measures as if they should always tell the same story.
They do not.
Verified facts
- 361 of 495 ready-market stocks rose.
- The top 10 names traded 231.2 million shares.
- Total ready-market turnover was 583.8 million shares.
- The top 10 therefore represented 39.6% of turnover.
- All 10 of the busiest names closed below PKR 36.
Named inference
Lower-priced, actively traded shares can generate large share counts for a given amount of money. This helps explain why turnover measured in shares can concentrate in a small group.
This is not a claim that those companies had the strongest fundamentals or produced most of the index gain.
The 10 busiest names
| Rank | Company | Turnover shares | Closing price (PKR) |
|---|---|---|---|
| 1 | K-Electric | 52,694,743 | 7.43 |
| 2 | Cnergyico | 37,967,202 | 9.57 |
| 3 | TPL Properties | 27,820,331 | 12.13 |
| 4 | Bank of Punjab | 24,396,355 | 33.72 |
| 5 | TPL REIT Fund I | 18,233,374 | 10.11 |
| 6 | LSE Capital | 15,426,163 | 7.42 |
| 7 | First National Equities | 15,342,440 | 1.22 |
| 8 | Ghandhara Tyre | 14,453,671 | 35.57 |
| 9 | Blue-Ex | 12,626,042 | 7.93 |
| 10 | TPL Corp | 12,268,573 | 16.74 |
K-Electric and Cnergyico alone traded 90.7 million shares.
The list also shows why share count needs context: every company in the top 10 closed below PKR 36. A lower share price can produce a larger number of shares traded for the same rupee amount.
That does not make turnover unimportant. It means turnover should be read for what it measures.
Turnover is not index contribution
A high-turnover stock is not automatically a major driver of the KSE-100.
The KSE-100 uses free-float market-capitalisation weighting. Daily share turnover is not the weighting rule.
This creates three separate questions:
- How many stocks rose or fell?
- Where did the most shares change hands?
- Which weighted companies contributed most to the index move?
A strong market reading keeps these questions separate before combining them.
The rebound also came with lower activity
The KSE-100 rose 1.02%, but ready-market turnover fell to 583.8 million shares from 912.6 million shares a day earlier. Ready-market traded value also fell to PKR 26.05 billion from PKR 45.61 billion.
So the 15 July session showed:
- broad price participation;
- lower overall activity than the previous day;
- concentrated share turnover within the session.
This does not make the rebound “false.”
It means the rebound should be described accurately rather than compressed into one headline.
What supports the reading
The interpretation is supported by three official PSX observations:
- a large majority of ready-market companies rose;
- the top 10 names represented almost two-fifths of share turnover;
- overall ready-market activity was lower than the previous session.
Together, these figures describe a broad but less active rebound with concentrated trading.
What weakens the reading
One session is not enough to establish a durable market pattern.
The concentration signal would weaken if later sessions show:
- many stocks continuing to rise;
- total turnover improving;
- the top-10 share of turnover falling materially;
- activity spreading across more sectors and companies.
The main risk is interpretation error.
A reader may confuse:
- many stocks rising with evenly distributed trading;
- high share turnover with high rupee value;
- high turnover with high index contribution;
- one broad session with a confirmed longer-term trend.
Each conclusion requires a different measure.
For the next sessions, compare these three items together:
- Price participation: how many stocks rise and fall?
- Turnover concentration: what share of ready-market turnover sits in the busiest names?
- Index contribution: which large weighted companies move the KSE-100?
If gains remain broad and turnover spreads beyond the top names, the rebound becomes more broadly supported by activity.
If many stocks rise but turnover remains concentrated and overall activity stays weak, the market structure remains mixed.
Sources & notes
- Pakistan Stock Exchange, Daily Stock Market Report, 15 July 2026.
- Pakistan Stock Exchange, Closing Rate Summary, 15 July 2026, Flu No. 873/2026.
- Pakistan Stock Exchange, KSE-100 Index Methodology.
All turnover figures in this article refer to the ready market/REG segment. Futures, NDM, off-market, block trades and post-close activity are excluded from the central calculation.