The mechanism in brief. Mutual funds bought $63.4m of equities in the week ending 19 June 2026. Insurance companies sold $59.7m. The two largest domestic institutional cohorts were on opposite sides of the same market, but that does not mean one was right and the other was wrong.
The Flow Split
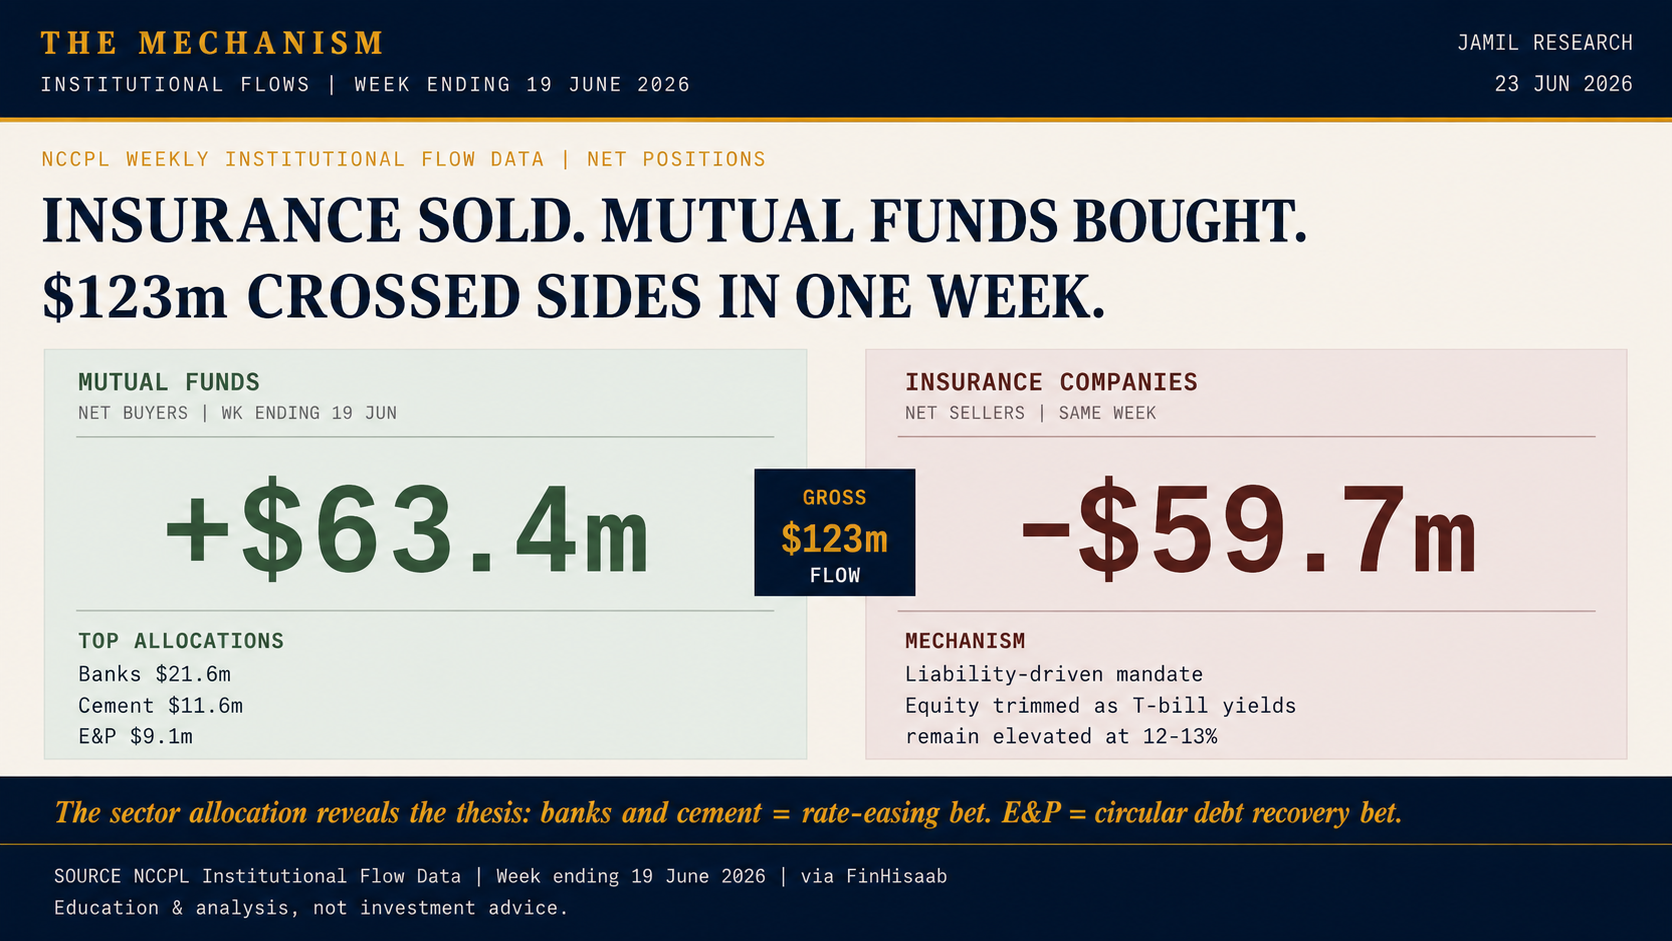
The weekly flow table showed a clear domestic divergence.
| Investor cohort | Net flow | Read |
|---|---|---|
| Mutual funds | +$63.4m | Return-seeking equity allocation |
| Insurance companies | -$59.7m | Liability-driven rebalancing |
| Foreign institutional investors | +$1.9m | Effectively neutral |
The combined gross flow across mutual funds and insurance was roughly $123m. For PSX liquidity, that is meaningful.
The index moved higher because mutual fund buying was larger, more equity-directed, and concentrated in sectors that could lead a re-rating.
Mutual Funds Were Buying a Thesis
The sector allocation explains the thesis.
Banks received $21.6m. Cement received $11.6m. E&P received $9.1m. Power, technology, food, and fertiliser received smaller allocations.
This is a rate-easing and fiscal-improvement basket.
Banks and cement are direct beneficiaries of lower rates. Banks can see better loan demand and a changing spread environment. Cement demand can improve when construction financing becomes cheaper and the infrastructure pipeline strengthens.
E&P is different. It is not simply an oil bet. It is a receivables-recovery and circular-debt discount bet. If lower oil eases fiscal pressure, the government's capacity to settle energy receivables improves.
That is why the allocation matters. It tells us what the mutual fund industry believed was being repriced.
Insurance Selling Was Not a Bearish Signal by Itself
Insurance companies should not be read like equity mutual funds.
Their portfolios are shaped by liabilities, duration matching, regulatory constraints, and fixed-income alternatives. When T-bill yields remain elevated around the 12-13% area, government paper can be attractive relative to equity volatility.
Selling equities after a market rally can also be mechanical rebalancing. If equity prices rise, the equity share of a mixed portfolio rises. Bringing the allocation back to target requires selling.
That is not the same as saying equities are unattractive. It says the investor's mandate is different.
What the Divergence Reveals
The divergence reveals two readings of the same market.
Mutual funds were looking forward to an easing cycle and buying sectors that could benefit first. Insurance companies were managing liabilities and harvesting gains into still-attractive fixed income.
Both behaviours can be rational at the same time.
This is why the phrase “smart money sold” is too simple. There are different types of smart money, with different constraints and different scorecards.
What Would Confirm the Mutual Fund Thesis
The mutual fund thesis needs follow-through.
If mutual funds keep buying $30-50m per week over the next two to three weeks, the accumulation looks structural. If they reverse sharply, the $63.4m week looks tactical.
Sector consistency also matters. Sustained allocation into banks, cement, and E&P would confirm that the same easing-cycle and circular-debt thesis remains active.
What Would Break the Thesis
The thesis weakens if CPI does not soften, the SBP remains forced into a longer hold, or circular-debt settlement does not progress.
It also weakens if mutual fund buying disappears while insurance selling continues. In that case, the market loses its clearest domestic absorber.
What to Watch
Three primary-source items matter most: the next NCCPL weekly flow data, the next CPI prints, and the SBP's next policy communication.
The flow data shows whether buying continued. CPI shows whether the rate-cut path is becoming real. SBP communication tells the market whether the central bank is moving closer to easing or still waiting for proof.
Primary source: NCCPL institutional flow data, week ending 19 June 2026, via FinHisaab.
Education & analysis, not investment advice.